CRM Predictive Forecasting Accuracy Benchmarks
Most sales teams forecast inaccurately because they buy tools before fixing data.
Fewer than one in four sales leaders report forecasts accurate within 10% of actual outcomes, according to Gartner's 2024 research, and top-tier accuracy remains vanishingly rare. This piece maps the gap between those two numbers: the four performance tiers CRM forecasting sorts into, what puts an organization in one band versus another, and the sequence that moves a team upward without skipping a step that comes back to bite it later.
The reality is that most enterprises miss revenue targets, a pattern consistent across independent benchmarks. That's the business cost sitting downstream of a measurement problem nobody fixed. Data volume has exploded over the past decade, yet accuracy hasn't moved much at all, and the interesting question is why a handful of organizations clear the bar while most don't. The honest answer is that almost everyone skips the boring fix and buys the exciting tool instead. That sequencing mistake, tool before foundation, is the argument this piece keeps circling back to, and it's the position worth stating up front: buying AI forecasting software before fixing CRM data ranks among the most common and most expensive errors a sales org can make.
How the benchmark tiers are defined and what separates each band
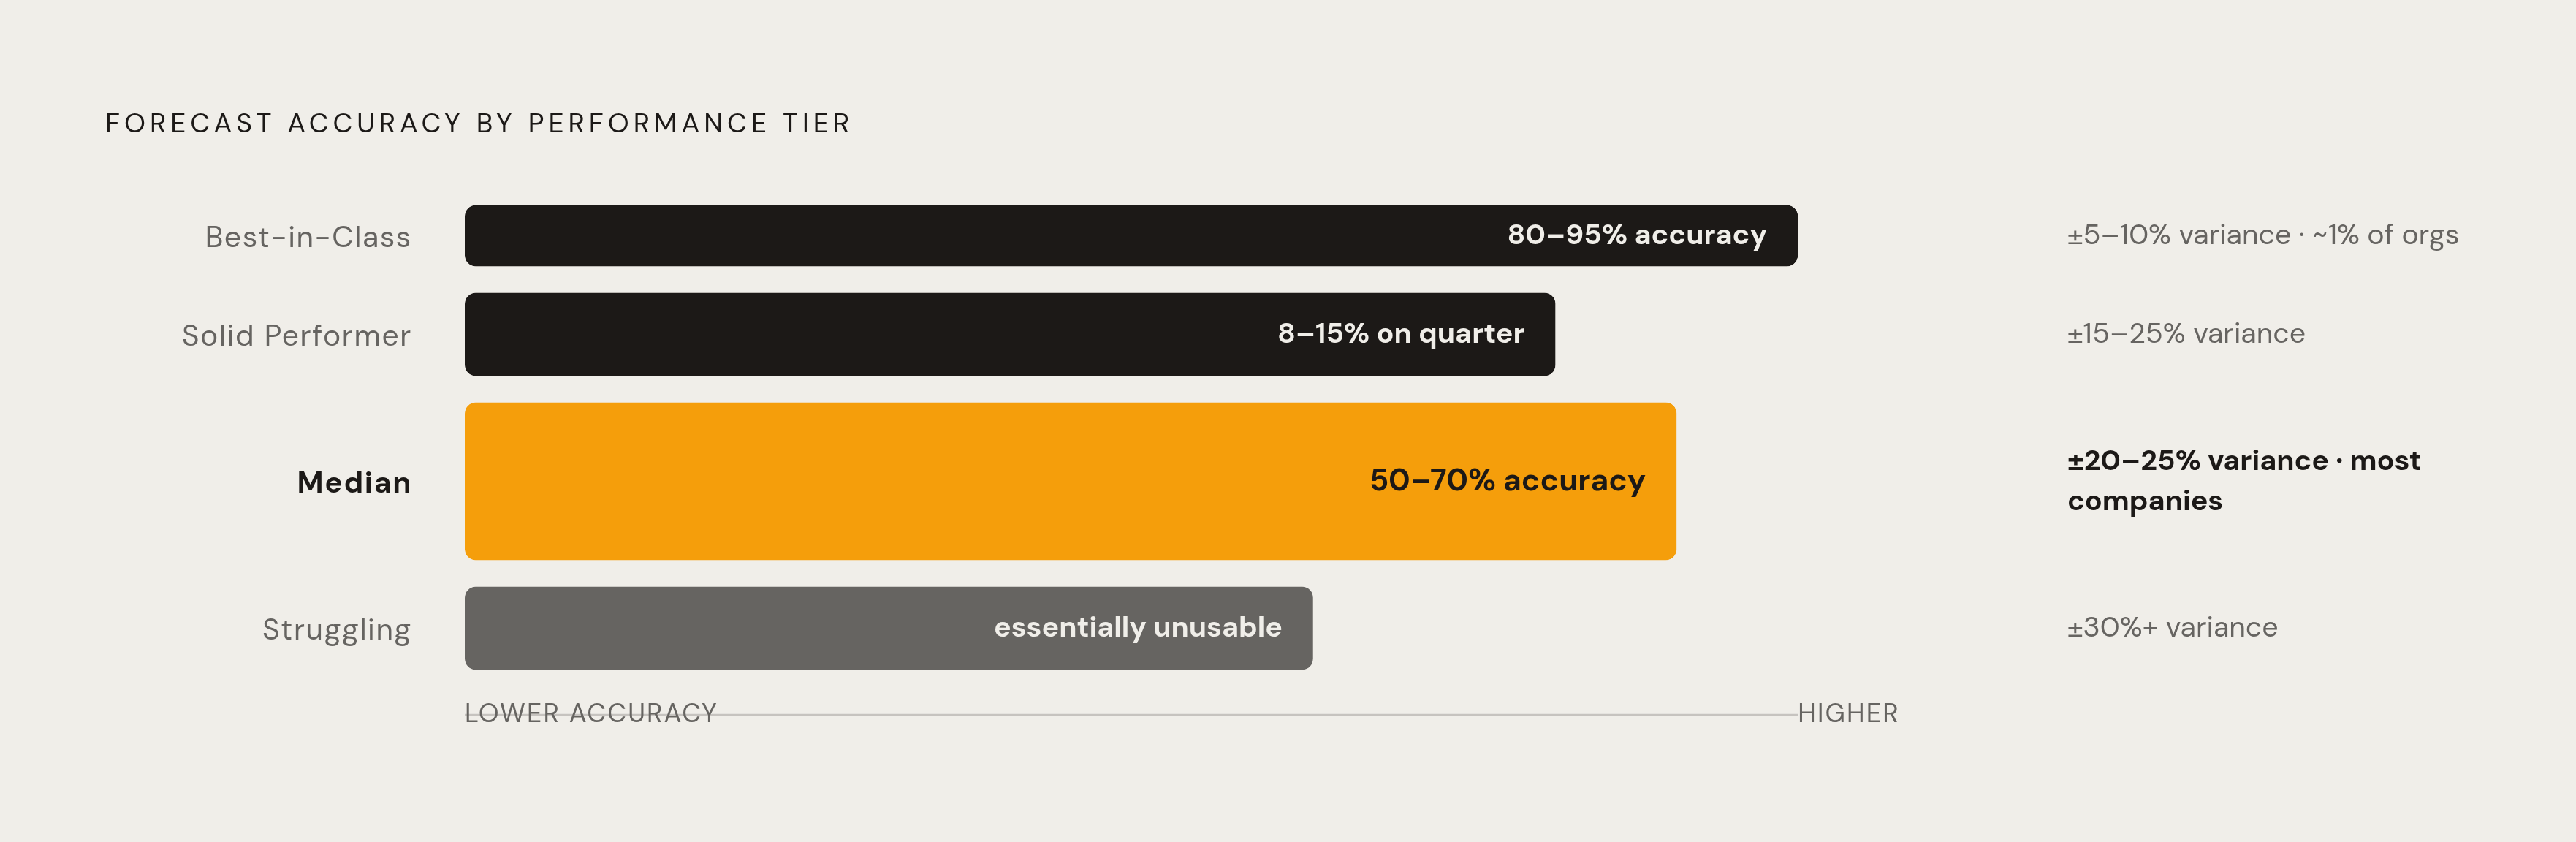
Pull together the convergent research, Optifai's analysis of 939 companies across Q2 2025 through Q1 2026, and Eagle Rock CFO's 2026 benchmarking work, and four bands fall out cleanly.
Best-in-class sits at ±5 to 10% variance, with the strongest organizations landing 80 to 95% accuracy. Solid performers run ±15 to 25% variance, with quarterly forecasts landing within 8 to 15% of actuals. The median band, where most companies actually live, sits at ±20 to 25% variance with accuracy typically in the 50 to 70% range. Struggling organizations post ±30% or worse, a point where the forecast stops being useful for decision-making at all.
Here's a wrinkle that trips up self-assessment: horizon decay changes which tier a team lands in depending on when it measures. Optifai's data shows 30-day forecasts running 85 to 90% accurate, 60-day forecasts dropping to 75 to 80%, and 90-day forecasts sliding to 65 to 75%. A team congratulating itself on solid-performer numbers at 30 days might be sitting squarely in median territory once the horizon stretches to 90. Which number counts as real depends on what decision you need to make with it, and that's worth sitting with before you print the QBR slide.
The tiers aren't evenly populated, either. The 95%-plus threshold is thin, while the median cluster is dense, since that's where the crowd lives, and the struggling band is bigger than most internal reporting admits, because almost nobody stands up in a QBR and says outright that the team is guessing. What separates these bands has less to do with which software sits on a rep's desktop and more to do with the data and process signature each tier carries, one that can be read before a tool even gets opened. The software argument comes later, and the short version is: it matters less than everyone wants it to.
Fullcast's 2025 Benchmarks Report found that even after quotas were lowered by 13.3%, nearly 77% of sellers still missed their number. Resetting the target doesn't fix the forecasting method underneath it; it just moves the variance to a different line on the spreadsheet.
The three structural causes that keep organizations pinned in the lower tiers
Three root causes show up across independent sources, and naming them precisely matters because they interact rather than sit in isolation. Stale CRM data is the biggest of the three, and it's not close.
Close dates go unupdated, deal amounts don't reflect the latest call, and research suggests the vast majority of opportunity-related data never makes it into the CRM at all. Sales leaders calculating velocity and win rates off the remaining 21% are forecasting off a small, unrepresentative slice of what's actually happening in the pipeline, and everything downstream of that number is guesswork.
Inconsistent deal staging is the second cause. When "Stage 3" means something different to one rep than it does to their manager, pipeline aggregation goes unreliable at the point of entry. The numbers roll up, technically, but the roll-up just doesn't mean anything.
Third is optimism bias, a symptom sitting on top of the other two rather than a separate problem in its own right. Research puts overconfidence and lack of objective evidence at the top of the barrier list, cited by a large share of organizations. Stale data leaves gaps; reps fill those gaps with gut feel instead of evidence, and inconsistent staging then hides the resulting pattern from any algorithm that might otherwise flag it. Three problems, one loop, not a checklist knocked out in order.
The downstream symptom is predictable: Research cited by forecastio.ai found a majority of forecasted deals in B2B sales slip to the next quarter. Optimism bias and poor stage hygiene compound in real time here, quarter after quarter, and the cost isn't abstract. Revenue loss from inaccurate forecasting driven by poor data quality can reach into the double digits of annual revenue.
There's a manager-side cost too, easy to miss because it looks like effort rather than failure. According to oliv.ai, implementations can take 18 to 24 months to reach meaningful accuracy, with managers spending 5 to 8 hours a week on manual review and CRM cleanup in the meantime. The system built to fix the accuracy problem creates its own drag while it's getting there.
What forecasting method an organization uses predicts which tier it occupies
Line up methods against accuracy bands and the mapping is almost too clean, though the method doesn't cause the tier so much as expose what the organization already was.
Gut-feel and rep-submitted forecasts run ±30 to 40% variance, tier-four by definition. That method leans entirely on the judgment source most exposed to optimism bias, so it lands in the struggling band by design, not by accident.
Weighted pipeline and stage-based forecasting improve on that, landing at ±15 to 25%. Better, but it inherits every inconsistent-staging problem from the section above, because weighting a stage that means five different things to five different reps just carries the inconsistency forward through a formula.
Multi-variable regression and machine learning can get you to ±5 to 15%, but only if your organization has enough historical data and clean CRM hygiene to feed the model something real. This method goes after the three root causes directly instead of working around them.
Research from articsledge.com found B2B machine-learning forecasting hitting 88% accuracy against 64% for traditional spreadsheets, a gap that maps almost exactly onto the distance between the struggling and solid tiers. Vendor decks tend to skip a related catch: ML doesn't deliver ±5 to 15% on dirty inputs. If you bolt machine learning onto a CRM full of stale close dates and inconsistent stages, you'll likely stay right where you are, just with a fancier dashboard. The tool upgrades; your tier generally doesn't.
Method choice reveals organizational maturity more than it creates it. A team that can't agree on what "qualified" means can't run weighted pipeline correctly, let alone feed a regression model anything useful. That sets up the next question directly: what does AI actually buy an organization, and does the evidence match the sales pitch?
What AI actually delivers on forecast accuracy (and the gap between adoption and outcome)
Here's the paradox in two numbers: Gartner found 89% of surveyed organizations already use AI-based predictive analytics, and only 1% of sales leaders achieve accuracy above 95%. The tools are everywhere; the outcomes lag far behind, and that gap is the whole argument of this section. It's also the clearest evidence that adoption and results are two separate questions most vendors would rather not separate.
When the prerequisites get met, the lift is real. McKinsey's research puts AI-powered forecasting's accuracy improvement at 20 to 30% over traditional methods. Optifai's research narrows the improvement to 15 to 25%, and names the drivers explicitly: CRM data quality, deal stage definitions, and rep sandbagging.
Notice the pattern in that list. None of those three drivers is which vendor a company bought, and all three are the same structural causes from two sections ago, which is exactly the part worth underlining rather than skimming past.
The prerequisite problem is straightforward: when a substantial share of your input data is unreliable, even sophisticated algorithms can produce unreliable forecasts. Bad inputs produce bad outputs no matter how advanced the processing sitting in between. The 89% adoption figure almost certainly includes a large number of organizations whose data never clears that 25% threshold, which is exactly why adoption is nearly universal while 95%-plus accuracy stays a rounding error of a statistic.
What AI actually needs to hit benchmark-level accuracy: clean CRM data, at least a year of deal history, and consistent stage definitions across the org. Those three requirements sit upstream of the technology; they're process work that happens to gate whether the technology works at all.
So the position stands: if your organization is sitting in the struggling or median tier, buying AI before fixing the inputs can carry real risk. It's tier-three spending for tier-four results, and no amount of model sophistication buys back that mismatch. Sequence matters more than budget here, full stop.
Platform-level evidence: what Clari and Salesforce Einstein show about the ceiling and the path
Platform data gives the abstraction some texture, with two named examples pointing in different directions.
Clari's Revenue Orchestration Platform was the subject of a Forrester Total Economic Impact study published in September 2025. The composite enterprise in that study reached 96% forecast accuracy, near the top edge of the best-in-class band, which translated into a 90% reduction in misallocated funds, a 398% return on investment, and $96.2 million in benefits calculated over three years. Separately, Clari Forecast's own claim is 98% accuracy by week two of the quarter, the outer edge of anything a production benchmark reports anywhere in this research.
Salesforce Einstein Forecasting tells a slower, more textured story. A published case study showed accuracy climbing from 68% to 84%, a 16-point gain, after AI-generated predictions replaced rep-submitted commits as the primary forecast basis. Over the following two quarters, manager overrides of the AI forecast dropped 41%, and the overrides that remained got more accurate too. That's a team learning to trust a system, though the catch is that getting there took the same 18 to 24 months and the same 5 to 8 hours of weekly manager time on data validation mentioned earlier. The path to 84% is longer and far more hands-on than any headline number suggests.
Put the two platforms side by side and one pattern emerges: the headline accuracy figures are real, but they're the trailing result of sustained process work, not something a license produces on day one. A 98% claim and an 84% case study aren't in conflict; they're two points along the same climb, recorded at different stages of the ascent.
Why CRM data quality and pipeline coverage ratios determine which tier you actually reach
One genuinely underrated finding: companies that clean up CRM data hygiene can raise forecast accuracy by up to 30%, without touching their platform at all. That's a median-to-solid-performer jump sitting on the table before a single new tool gets bought. Gartner also found that embedding forecast coaching into the sales process, a manager sitting with a rep and pressure-testing the number line by line, adds meaningful accuracy on its own. Both levers are behavioral rather than technological, and the two biggest gains in this entire piece cost nothing in software, which is worth sitting with for a second before the next platform demo.
Pipeline coverage math has quietly shifted underneath a lot of sales organizations without anyone updating the spreadsheet. Multiple sources indicate that median B2B win rates have declined in recent years. At a substantially lower win rate, the coverage needed just to hit target runs meaningfully higher than the old "3x pipeline coverage" rule of thumb, a rule calibrated back when win rates ran higher. If you're still running that old ratio, you may be using a formula built for a market that no longer exists.
There's also the raw-versus-qualified pipeline gap, which is substantial by most measures. Your sales team may believe it's carrying adequate coverage while sitting on far less once the unqualified deals get stripped out, and that inflation can show up in your forecast before any algorithm ever touches the numbers.
The specific data killers worth naming in your CRM: (i) missing contacts, (ii) duplicate accounts, and (iii) pipeline that hasn't been touched in 30-plus days. All three are CRM hygiene problems, and all three are fixable before anyone opens a forecasting tool. There's a detail that reframes the usual "just enter better data" advice, though: A significant share of sales reps report spending too much time on data entry, leaving limited time for actual selling. That's a workflow design problem, one better addressed by cutting the burden on reps than by nagging them harder about updating fields nobody built a shortcut for.
A sequenced path for moving from one benchmark tier to the next
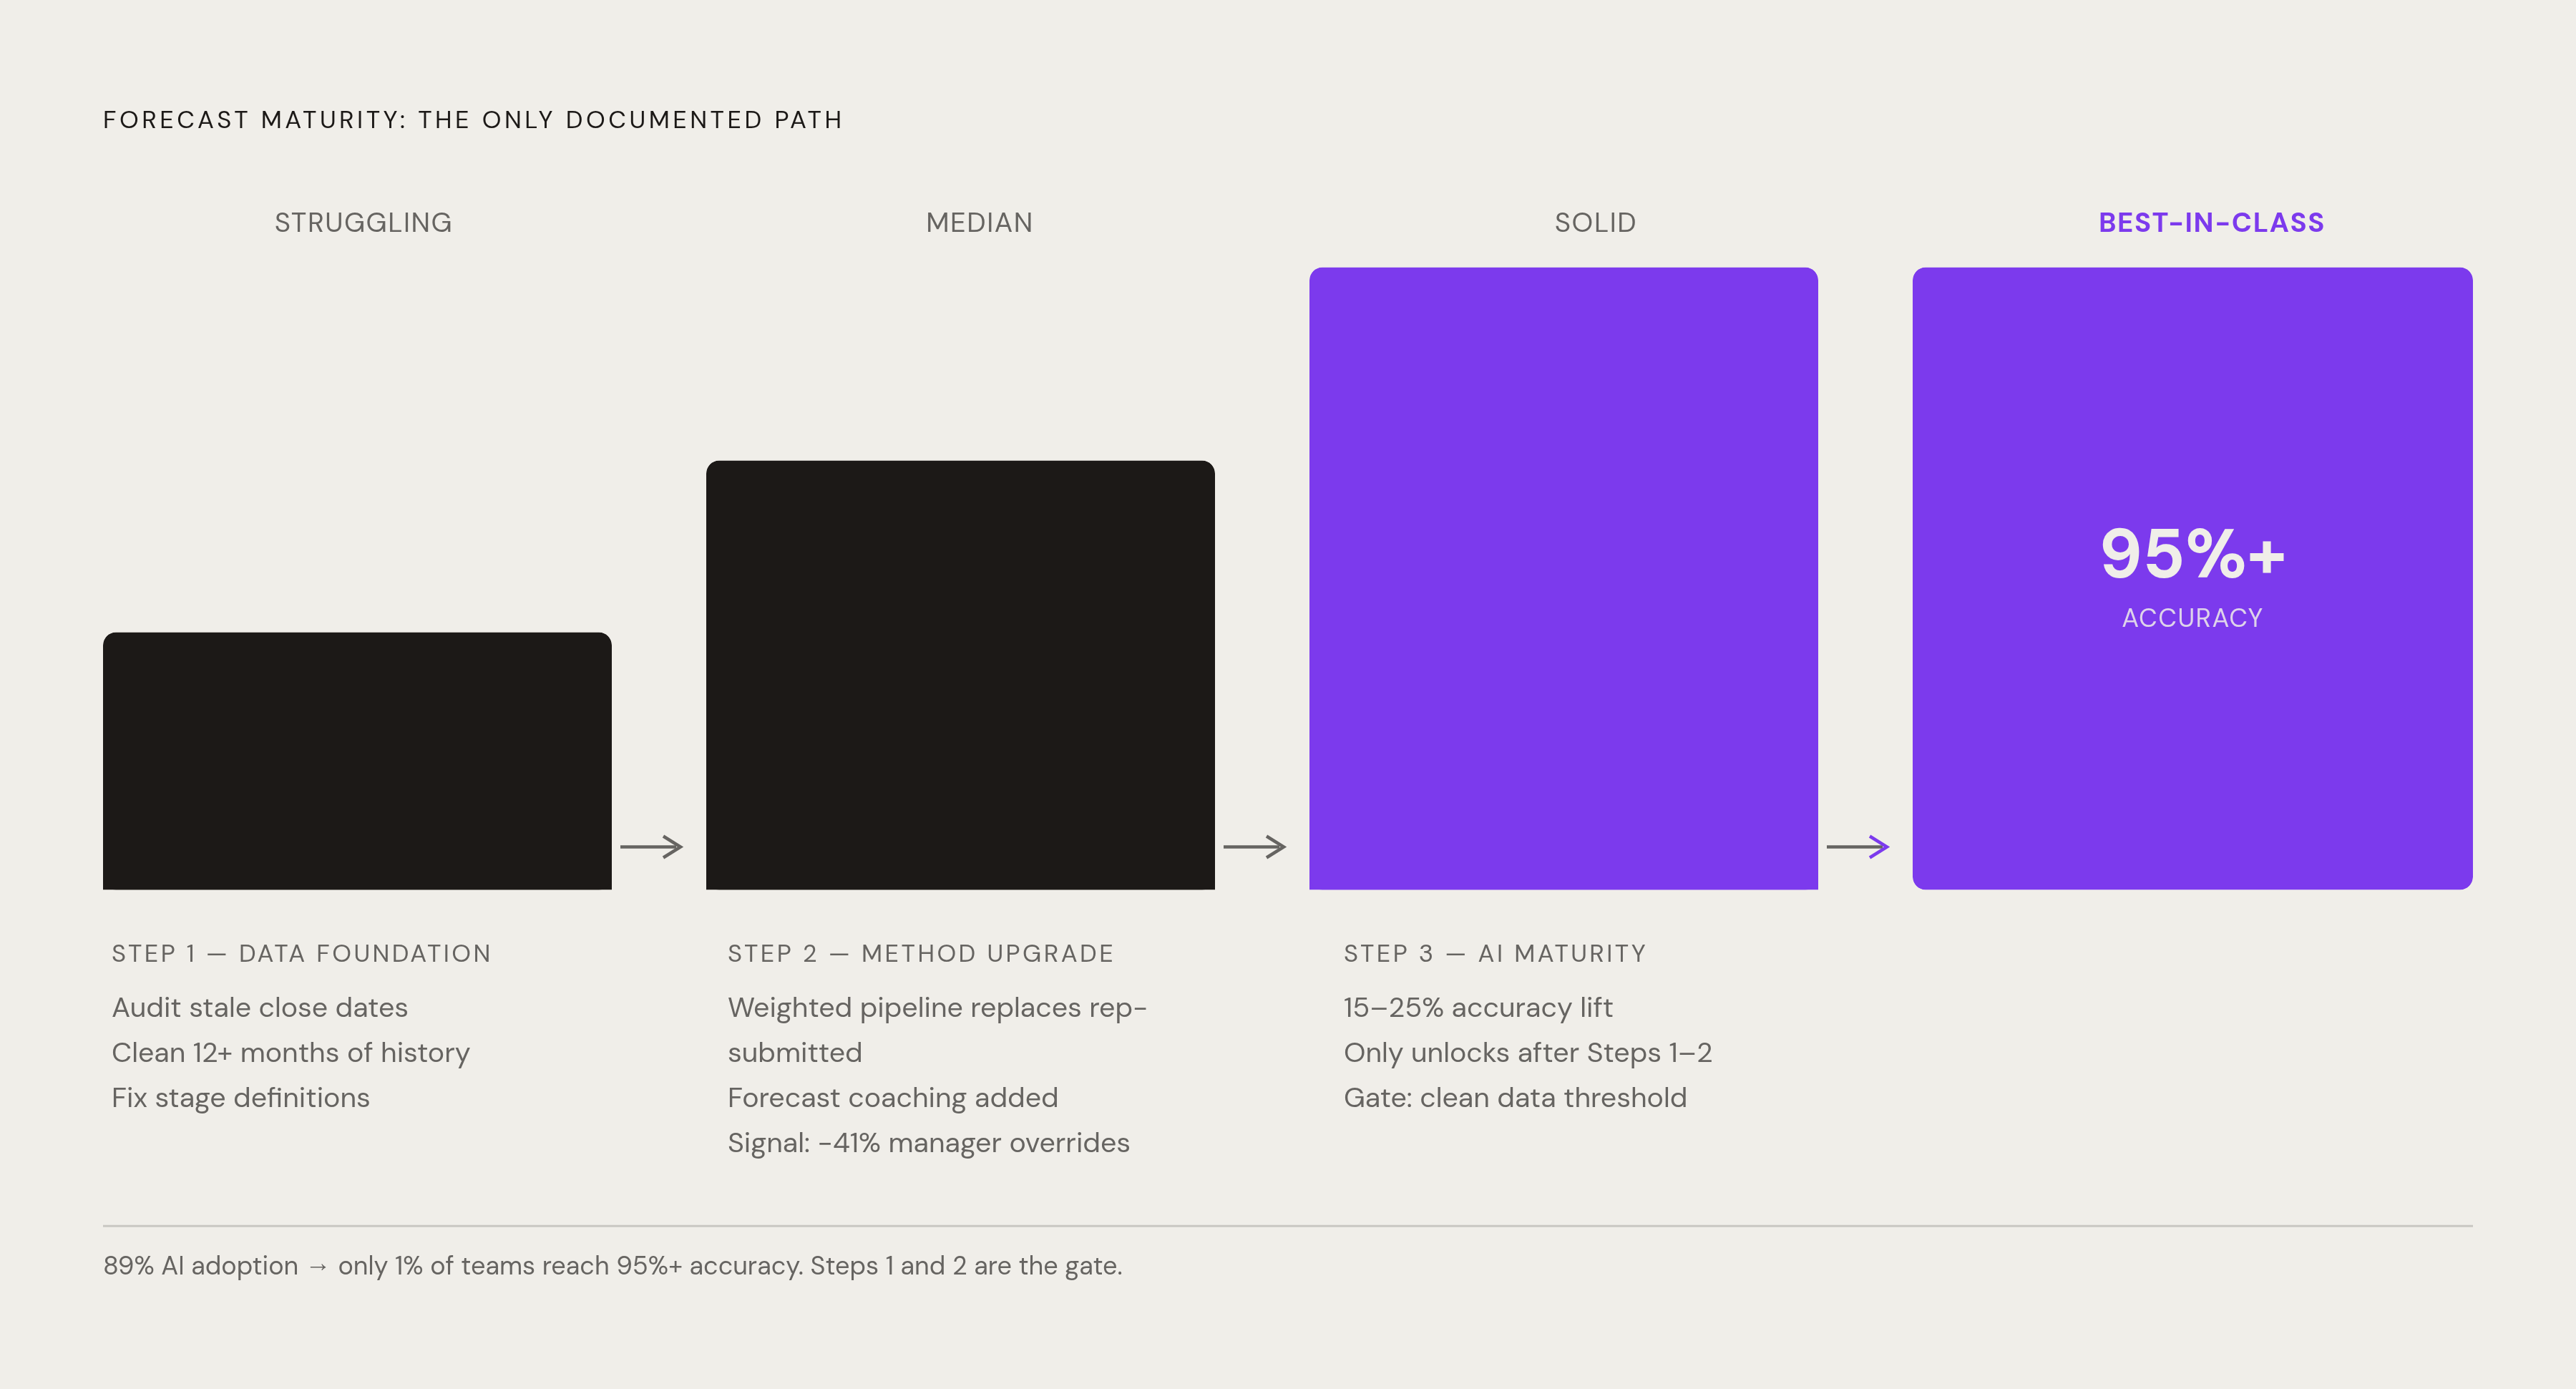
Start with diagnosis, not treatment. Calculate the variance between submitted forecasts and closed revenue across the last four quarters, then place that number against the bands from the first section: ±30%-plus is struggling, ±15 to 25% is median, ±5 to 10% is best-in-class. No tool purchase should happen before this step, and skipping it is the single most common mistake this piece keeps circling back to.
Struggling to median is the data foundation move. Audit your CRM for the three root-cause signals: (i) stale close dates, (ii) gaps in stage definitions, and (iii) rep-level optimism patterns showing up as chronic slippage. Fix stage exit criteria before touching any weighted or algorithmic method, because a smarter algorithm downstream doesn't fix poor input quality upstream. Start building the 12-plus months of clean historical deal data that any AI-assisted method will eventually need as a baseline.
Median to solid performer is the method upgrade. Shift your primary forecast input from rep-submitted numbers to weighted pipeline; the Einstein case study's jump from 68% to 84% shows what that shift can produce on its own, even before full machine-learning maturity kicks in. Layer in forecast coaching alongside whatever tooling gets adopted, since Gartner's 15% coaching-driven gain stacks on top of technology gains rather than competing with them. Work deliberately to shrink manager override volume, building trust in the algorithmic baseline the way the Einstein case did, where a 41% drop in overrides tracked directly with the accuracy improvement.
Solid to best-in-class is the AI maturity move, and it comes last for a reason: the 15 to 25% accuracy lift from AI-assisted forecasting is generally only available to you once your data clears the clean threshold. Skip ahead of that and the lift simply doesn't show up, no matter what the vendor promised in the demo. Your platform choice, Clari, Salesforce Einstein, or another option, matters less at this stage than the quality of what you're feeding into it; both platforms can reach best-in-class numbers once you've actually met the prerequisites. And the commercial motions sitting downstream of the forecast, the planning and execution work that turns a number into a result, need to be just as consistent, or the accuracy gain evaporates the moment it leaves the forecasting layer.
None of this sequence is optional, and skipping steps just relocates the failure to a later, more expensive point in the process. That 89% adoption rate against a 1% rate of hitting 95%-plus accuracy is the proof sitting in plain sight: most of that gap is organizations that bought the tool and skipped the foundation underneath it. Benchmark tiers describe where your organization stands today, not where you're stuck forever, and every best-in-class forecasting operation started in a lower band and moved through the same order: (i) data first, (ii) method second, (iii) algorithm third. There isn't a documented shortcut, and given how consistently the data lines up on this point, if you're still hunting for one, you can probably stop looking.