Setting CRM KPIs That Connect to Revenue
Work backward from revenue targets to identify which CRM metrics actually drive results.

Hand me a revenue target and a current pipeline snapshot, and I can tell you in five minutes whether those two things are compatible. Not because of some special intuition; the arithmetic is genuinely straightforward, it just rarely gets done in reverse. Think of it as reading a map from the destination back to the starting point — most people only ever read it the other way around.
Start with the number. Annual or quarterly, it doesn't matter. Then ask three questions: how much pipeline do you need, given your current win rate? How long does a deal take to move from qualified to closed? What's your average deal value, and how many deals does that require to hit the target? Each answer points directly to a measurable CRM variable. Those variables are your candidate KPIs. Anything not traceable to one of those three questions gets demoted.
This is where the leading-versus-lagging distinction stops being abstract. Revenue is a lagging indicator. By the time a shortfall appears in a quarterly report, the cause, typically a pipeline that thinned out weeks or months earlier, is already locked in. There is nothing actionable to do about Q3 revenue in Q3 if the leading indicators failed in Q1. A functional KPI set surfaces those signals thirty to ninety days earlier, when there's still room to move.
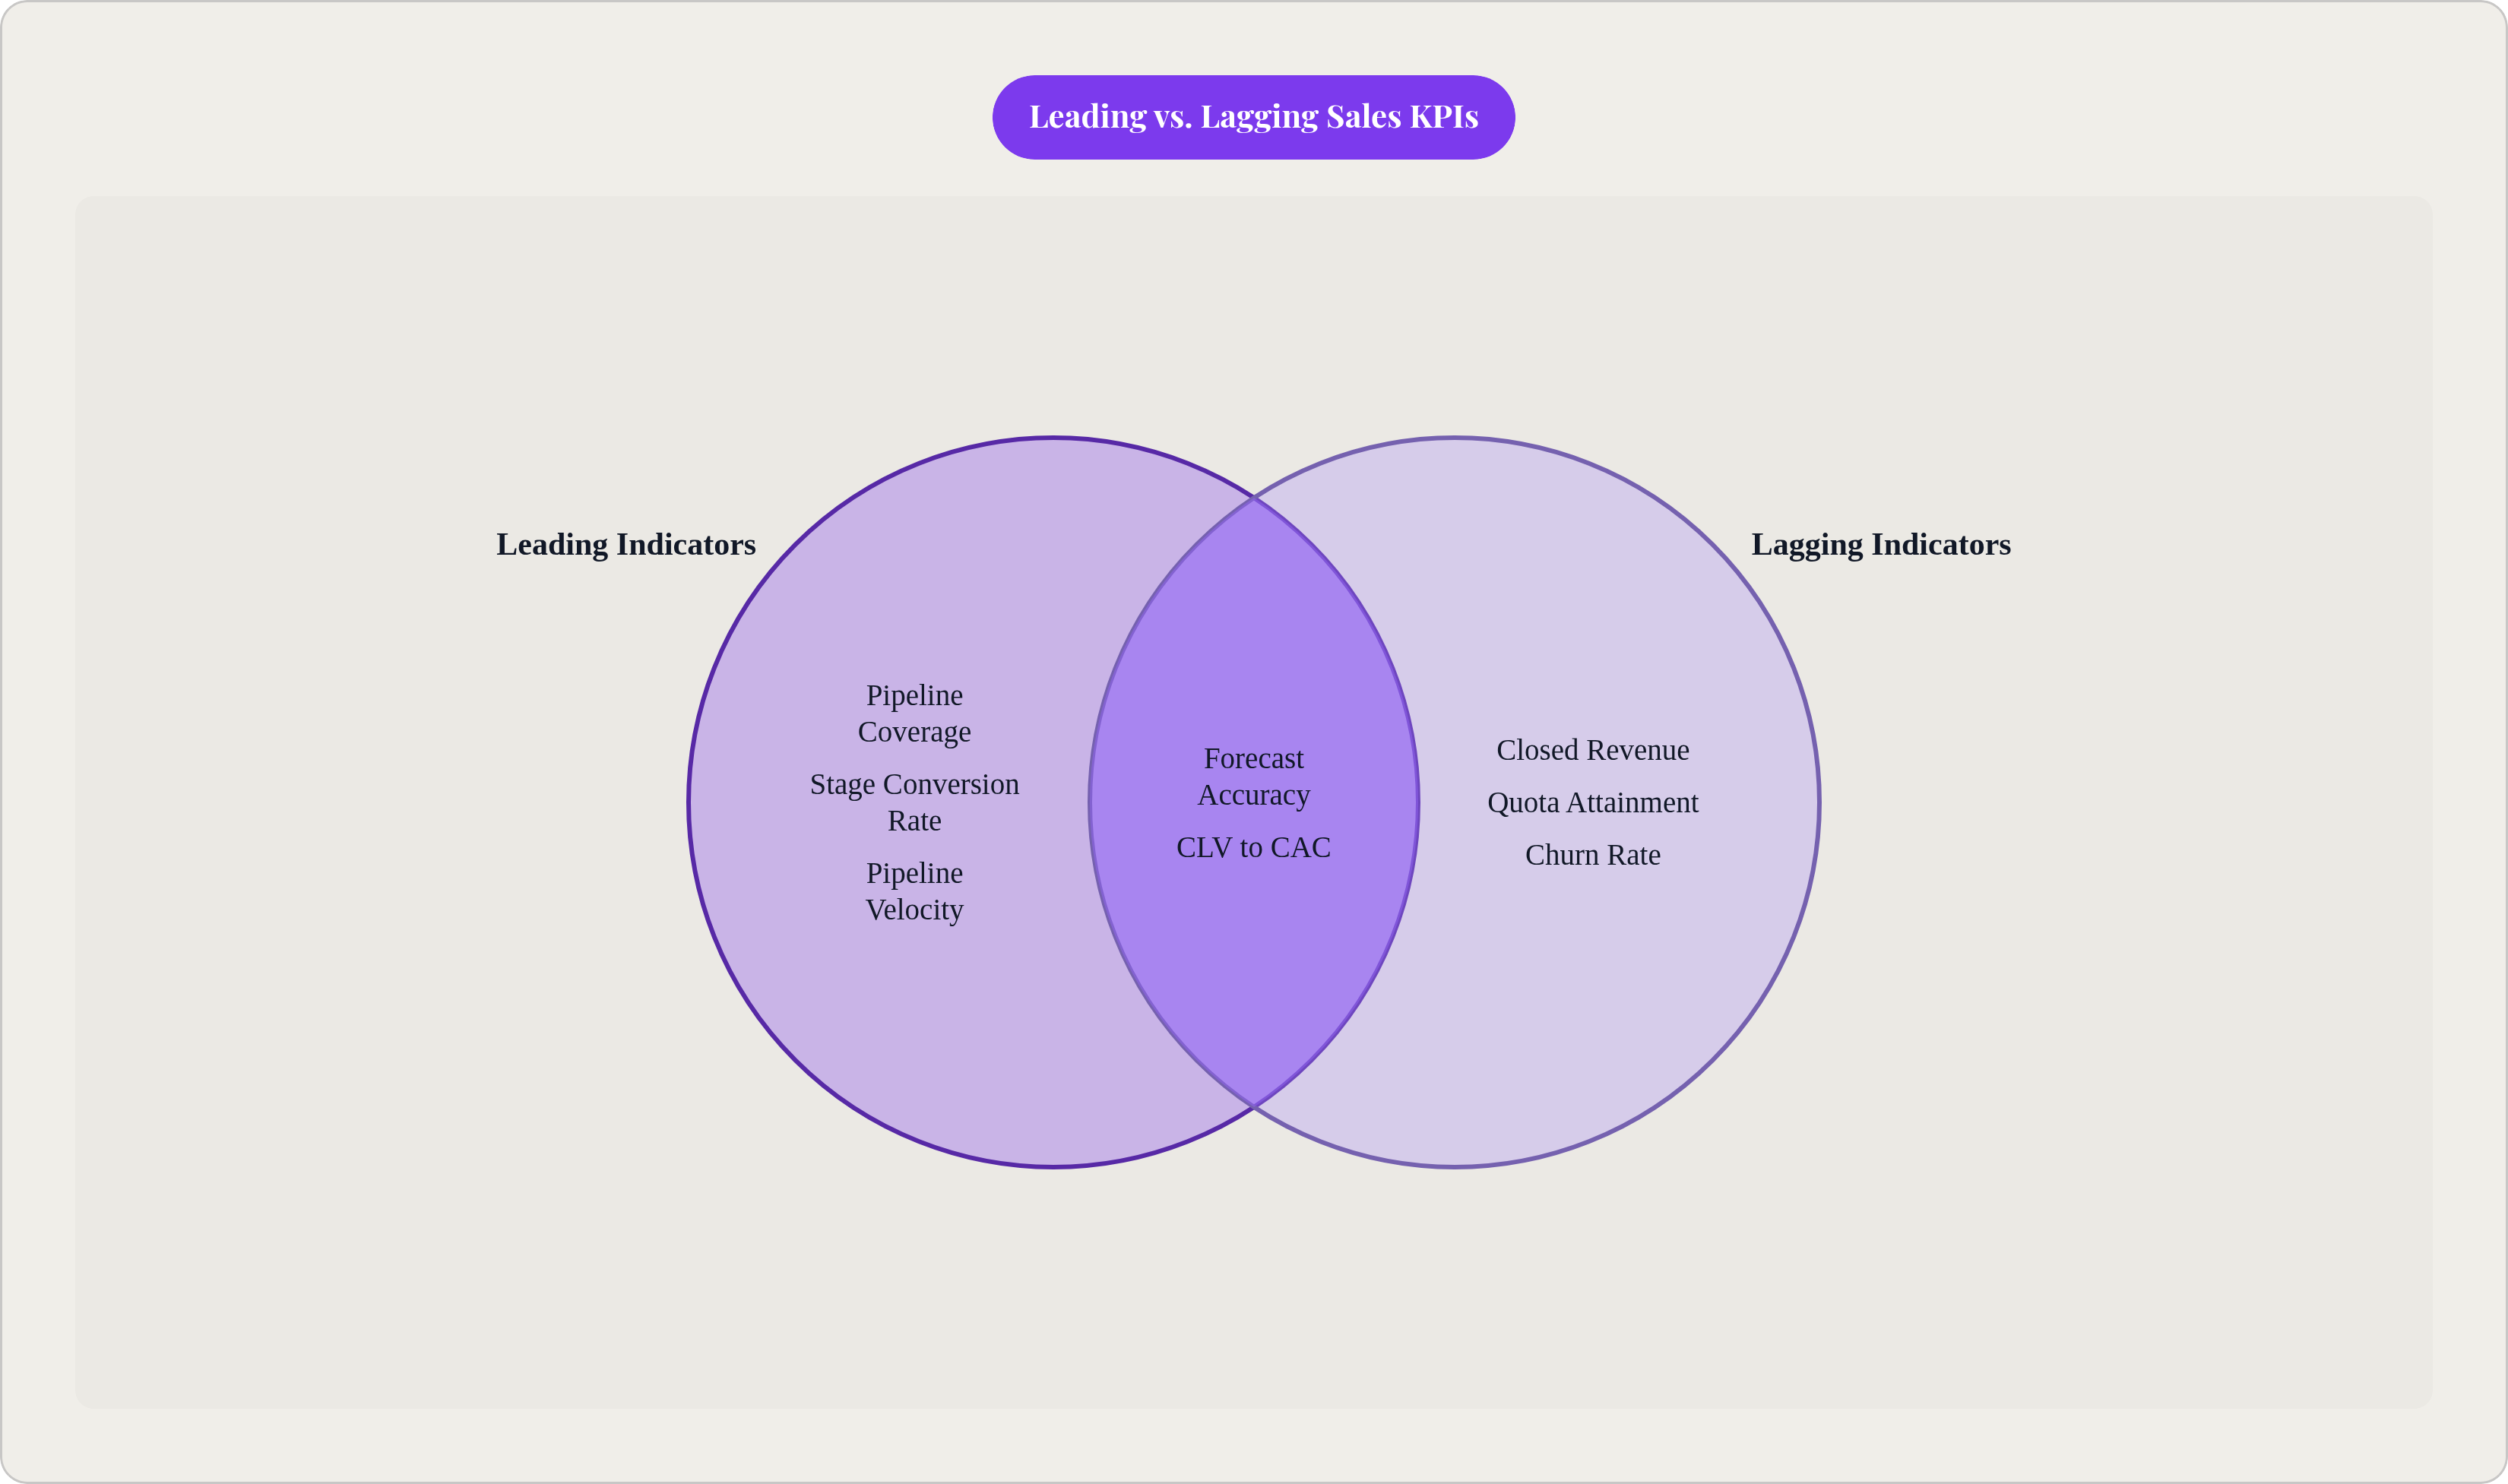
Pipeline coverage, stage conversion rates, and velocity changes are leading. Closed revenue and quota attainment are lagging. Both belong in the set, but they serve different functions. Leading metrics tell you what to do now. Lagging metrics confirm whether prior decisions held. Using lagging metrics to drive current behavior is like navigating by a map of where you've already been.
The mistake I see most often is that KPI selection gets treated as a post-implementation activity. Teams stand up the CRM, explore what it can track, and build dashboards from whatever the platform surfaces. That produces a KPI set derived from tooling constraints rather than business logic. The revenue model should come first. The fields and dashboards follow from it, not the other way around.
The test for any metric under consideration is blunt: if this number improves meaningfully, does revenue, margin, or cash flow benefit directly? Not indirectly, not eventually. Directly. If you can't draw that line clearly, the metric doesn't belong in your weekly review. It belongs in the background, available when someone needs to investigate a movement in an actual KPI, but consuming no attention in a leadership meeting.
Pipeline Velocity as the Single Metric That Ties Volume, Quality, and Speed Together
If I could keep exactly one metric in a B2B sales CRM, it would be pipeline velocity. The reason is structural: it compresses the three variables that actually determine whether a team hits its number: how much pipeline exists, how often deals close, and how fast they move. Individual metrics let each other hide; velocity doesn't offer that courtesy. It's the kind of number that tells you the whole joke at once — you can't ignore the punchline by looking at only one part of the setup.
Multiply the number of qualified opportunities by average deal value by win rate, then divide by average sales cycle length. That's the number. A team can carry impressive pipeline volume and still produce poor velocity if the win rate has quietly eroded or cycle length has crept up over several quarters. You'd never catch that by reviewing volume and win rate in separate slides, which is how most KPI reviews are structured.
The early-warning value is what justifies the attention. A metric reviewed quarterly functions as a historical record; a metric reviewed weekly functions as a navigation instrument. If velocity is declining in April, that shows up in bookings by June or July, which is too late for meaningful course correction. Catching it in April leaves room to act.
Pipeline coverage gives velocity its context. Velocity against a 2x coverage ratio tells a very different story than velocity against a 5x ratio. When coverage falls below 3x, a team is operationally betting that nearly every qualified deal closes. Median B2B win rates sit well below 50%, which makes that bet a losing one in most markets. B2B sales cycles have also been lengthening, which mechanically compresses velocity even when pipeline volume holds steady. Most KPI reviews miss this because they examine those variables in isolation rather than watching how they interact inside a single number.
One real caveat: velocity is an average, and averages obscure distribution. A handful of large, slow-moving deals can mask weak performance across the core book of business. If your deal mix is materially heterogeneous, segment velocity by deal size or customer segment before drawing conclusions from the aggregate. I've seen teams celebrate a strong velocity number that was almost entirely attributable to two enterprise deals, neither of which closed. The underlying business was in worse shape than anyone realized.
The Conversion and Retention Metrics That Complete the Revenue Picture
Pipeline velocity tells you how efficiently the funnel is running. Conversion and retention metrics tell you whether the funnel's inputs are sound and whether revenue, once captured, is actually holding.
Lead-to-opportunity conversion rate establishes the baseline math for pipeline planning. Once you know what percentage of leads become qualified opportunities, you can work backward from any revenue target to determine the required volume at the top. These rates vary meaningfully by channel and qualification approach. They function as diagnostics, not targets. If your rate is materially below benchmark for your primary acquisition channel and you're running a high-touch qualification process, the problem is usually qualification rigor rather than volume. More leads into a broken qualification process produces more noise, not more pipeline.
Win rate paired with average deal size is the core variable in any revenue projection. A team can compensate for a low win rate by running more volume, but that cost surfaces in customer acquisition expense and compounds over time. Win rate and average deal size also interact in a way that catches teams off guard: if average deal size is falling while deal count holds steady, revenue is eroding quietly, often before anyone flags it as a problem. If average deal size is rising, pipeline coverage requirements rise with it, because each deal now represents a larger share of quota.
For businesses with recurring revenue, retention is a customer success metric that belongs in the same KPI set as win rate and velocity, not siloed in a separate department's dashboard. The cost of replacing a churned customer is substantially higher than the cost of retaining one, and the profitability implications compound quickly. Customer lifetime value remains among the least-tracked metrics by sales and marketing teams, which is a competitive gap that most organizations leave open longer than they should.
The CLV to CAC ratio functions as an efficiency check on the entire revenue model. A ratio below 3:1 means you're overspending on acquisition relative to the value customers generate. Above 5:1, you are underinvesting in growth. For subscription businesses specifically, tracking MRR in its component parts, (i) new MRR, (ii) expansion MRR, (iii) churned MRR, and (iv) net new MRR, surfaces dynamics that aggregate pipeline metrics cannot. Expansion MRR reveals upsell momentum that would otherwise stay invisible until it shows up in revenue, at which point the insight is historical rather than actionable.
Forecast accuracy deserves mention as a meta-KPI. It doesn't measure business performance directly; it measures how well your measurement system is working. If your forecast is consistently off by a wide margin, the KPI set itself is the problem, not just execution. Most sales organizations do not achieve forecast accuracy above 75% consistently. That's because most KPI sets are not actually measuring the variables that drive outcomes, not because forecasting is inherently unreliable.
Structuring KPIs by Role So Each Stakeholder Sees the Signal Most Actionable for Them
A KPI is only useful if the person looking at it can act on it. The most common CRM configuration I encounter is still a single dashboard trying to serve an entire organization simultaneously. It optimizes, by default, for whoever is most senior in the room. Executives get what they need. Managers get a mix. Reps see numbers they can't influence at the right level of granularity and eventually stop trusting the system. That's not a technology failure; it's an architecture failure.
The correct structure is layered. Eight to twelve KPIs per role, selected specifically for the decisions that role actually makes.
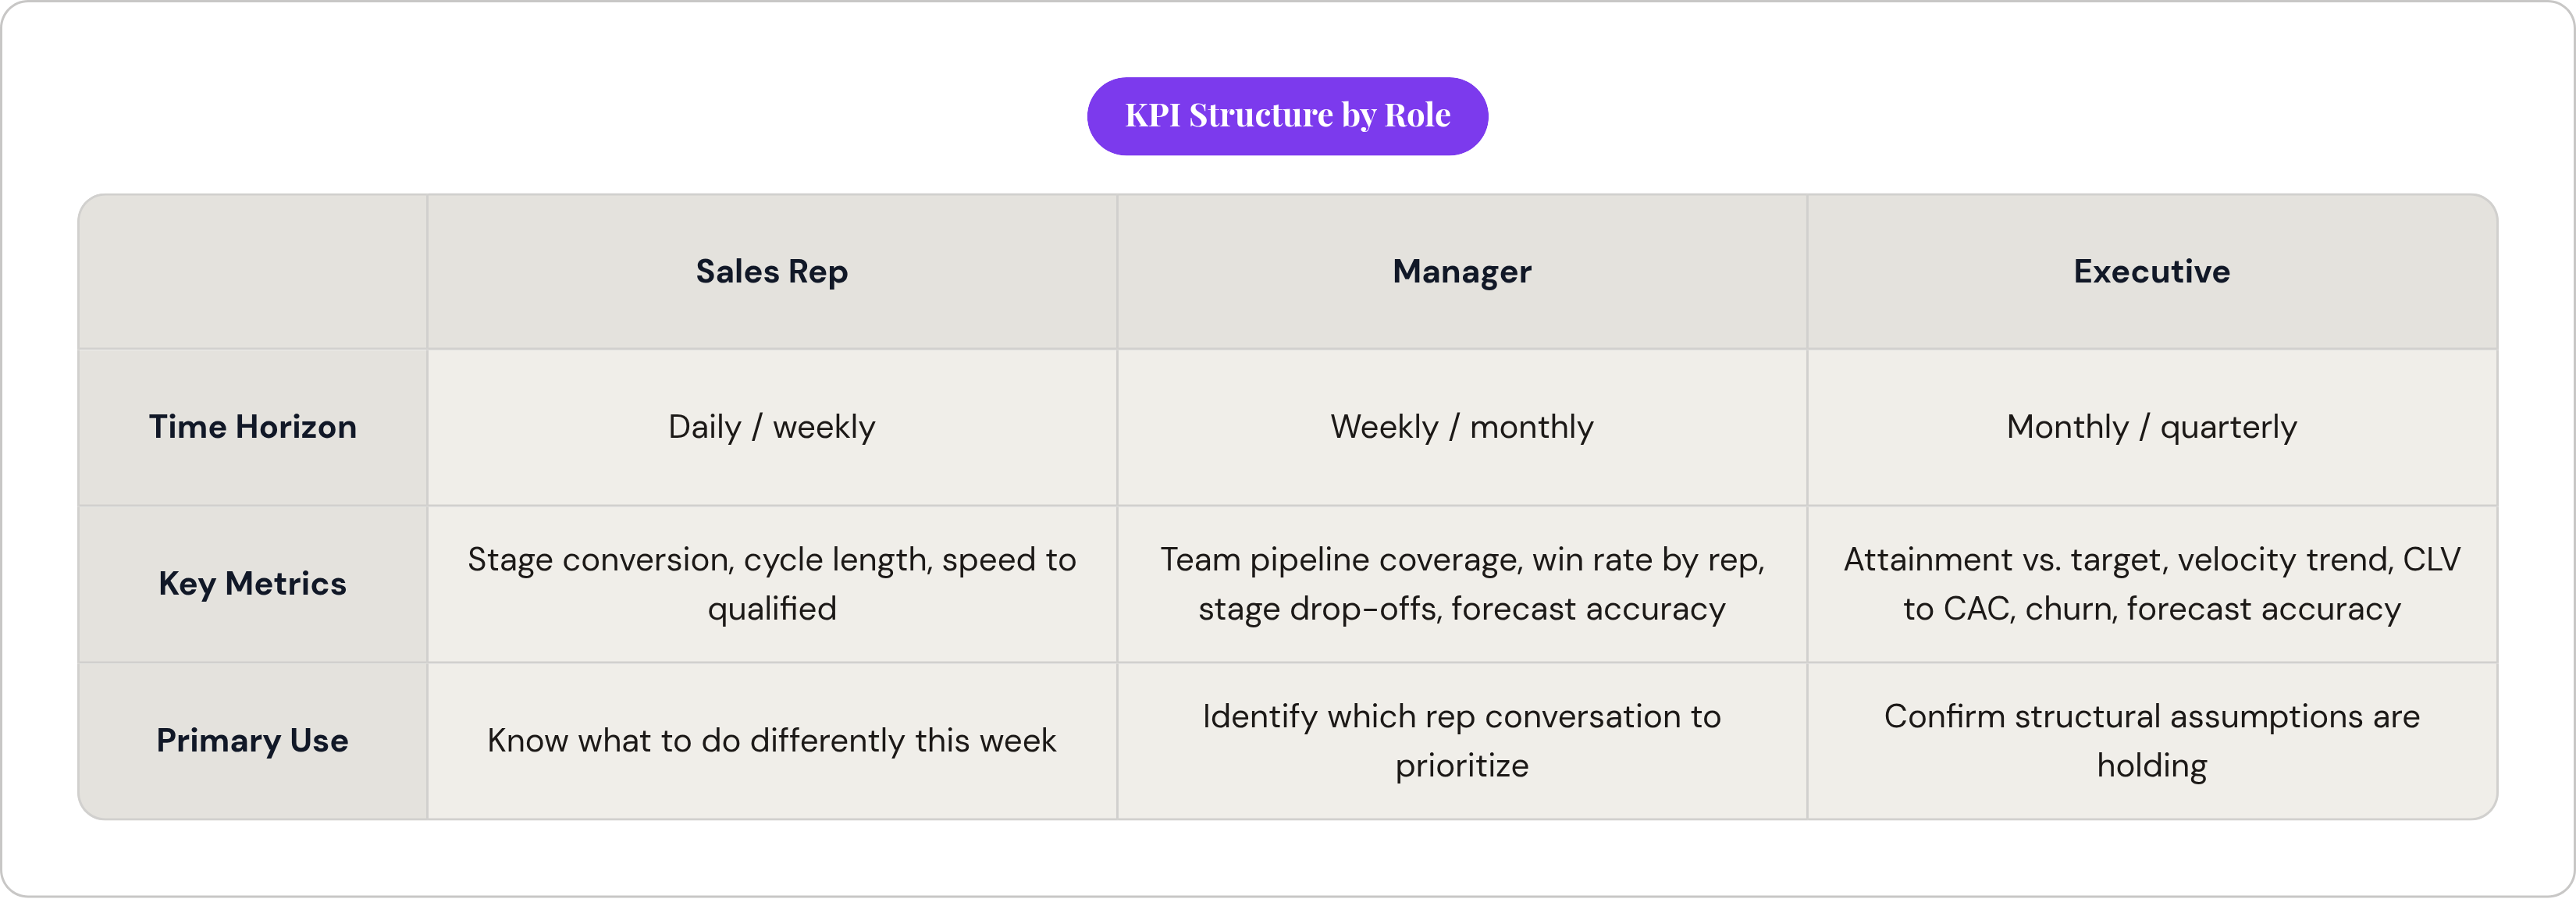
Reps operate on daily and weekly time horizons. Their metrics should reflect that cadence: stage conversion rates within their own pipeline, speed from first contact to qualified opportunity, cycle length on active deals. Numbers a rep can look at on a Tuesday morning and know exactly what to do differently before the week ends. Vague signals produce vague behavior, and vague behavior produces missed quarters.
Managers need visibility into patterns across a team. Their signal set includes (i) team-wide pipeline coverage, (ii) win rate by rep, (iii) stage conversion drop-offs that identify where deals are stalling, and (iv) forecast accuracy at the team level. A manager with a well-configured dashboard should be able to identify which rep conversation to prioritize this week, not just which deals are nominally at risk. That's the coaching view, and most CRM configurations don't actually provide it.
Executives and revenue leadership need metrics that reveal whether the revenue model itself is working: (i) attainment versus target, (ii) pipeline velocity trend, (iii) CLV to CAC, (iv) churn rate, and (v) forecast accuracy. These operate on monthly and quarterly intervals. They're not designed to drive daily behavior; they're designed to surface whether the structural assumptions underlying the plan are holding.
Salesforce's State of Sales research has consistently found that sales reps spend a significant minority of their actual working hours on direct selling activity, with the majority consumed by administrative and non-selling work. A role-structured KPI system that surfaces the right priorities at the rep level is partly a mechanism for recovering that selling time. When reps know exactly which two or three things to focus on, they spend less time interpreting dashboards that weren't built for them and more time in front of customers.
How to Audit an Existing CRM KPI Set and Cut What Doesn't Connect to Revenue
Start with an inventory. List every metric currently surfaced on your CRM dashboards or pulled into your regular reports. Most teams will find somewhere between twenty and forty data points tracked with varying degrees of attention. Some are reviewed weekly. Some were added during a platform migration and haven't been touched since. A few will produce a long pause when they appear on the list, because nobody in the room can remember why they were added. That pause tells you something: a metric no one can explain has been generating noise for longer than anyone realizes, and the organization has been quietly accommodating it.
Apply the revenue test to each one. If this metric improves by 20%, which revenue or margin outcome improves, and how quickly? Metrics that can't answer that question are candidates for demotion. Demotion means moving them out of the KPI set; some remain useful for investigating why a KPI moved after the fact, but they have no place in a regular review.
What survives falls into three categories. Revenue KPIs have a direct line to a revenue or margin outcome: pipeline velocity, win rate, CLV to CAC, churn, MRR components. Diagnostic metrics are useful for understanding why a KPI moved but aren't KPIs themselves: call volume, email open rate, meeting count. Vanity metrics should be retired or moved to background data. Vanity metrics are the participation trophies of measurement — everyone gets one, but they don't tell you who actually won.
The patterns that surface in these audits are consistent enough that I can anticipate them before the meeting starts. Pipeline coverage is tracked but never compared against win rate, so it provides no signal about whether the volume is actually sufficient. Lead conversion is measured at the top of the funnel but not by stage, which means no one knows where deals actually stop progressing. Forecast accuracy is reported after the quarter closes rather than used to drive mid-quarter adjustments, which renders it entirely retrospective. These aren't isolated configuration errors; they're symptoms of building a dashboard from available data rather than from a revenue model.
The reconfiguration sequence follows directly from the backward-design framework: (i) define the revenue target and the pipeline math required to hit it; (ii) identify the three to five metrics whose movement most directly predicts whether that math holds; (iii) assign each metric to the role that can act on it; and (iv) set review cadences that match the lead time of each metric, velocity weekly, CLV to CAC monthly, and churn monthly.
A clean KPI set has a recognizable shape. A rep sees stage conversion rates and cycle length on active deals. A manager sees team velocity, pipeline coverage, and win rate by rep. An executive sees forecast accuracy, net revenue retention, and CLV to CAC. No overlap, no redundancy, clear ownership at every level.
The audit is not a one-time event. As the revenue model evolves, through new segments, pricing changes, or shifting sales cycles, the KPI set should be re-derived from the updated model. The failure mode is straightforward: adding new metrics as conditions change without retiring the ones that no longer connect to the current business. KPI sets that grow without discipline become, over time, exactly the problem they were originally built to solve.